3 tidyverse
3.1 Brief Introduction to R on RStudio - Review
3.2 Set up
- Highly recommend to set the language to be “English”.
- Create “data” directory.
Sys.setenv(LANG = "en")
dir.create("./data")
3.3 Three Ways to Run Codes
- Console - Bottom Left Pane
- We have run codes on the console already!
- R Script - pull-down menu under File
- R Notebook, R Markdown - pull down menu under File
3.4 R Script - Second Way to Run Codes
3.4.1 Examples: R Scripts in Moodle
basics.Rcoronavirus.R
- Copy a script in Moodle: {file name}.R
- In RStudio (create Project in RStudio) choose File > New File > R Script and paste it.
- Choose File > Save As, save with a name; e.g. {file names} (.R will be added automatically)
To run a code: at the cursor press Ctrl+Shift+Enter (Win) or Cmd+Shift+Enter (Mac).
- Top Manu: Help > Keyboard Short Cut Help contains many shortcuts.
- Bottom Right Pane: Check the files by selecting the
Filestab.
3.5 Packages
R packages are extensions to the R statistical programming language. R packages contain code, data, and documentation in a standardised collection format that can be installed by users of R, typically via a centralised software repository such as CRAN (the Comprehensive R Archive Network).
3.6 R Notebook - Third Way to Run Codes
Choose R Notebook from the pull down File menu in the top bar.
3.6.1 Edit YAML
Default is as follows
title: "R Notebook"
output: html_notebook
Template
title: "Title of R Notebook"
author: "ID and Your Name"
date: "2023-12-04"
output:
  html_notebook:
#    number_sections: yes
#    toc: true
#    toc_float: true
- Don’t change the format. Indention matters.
- The statement after # is ignored.
- Date is automatically inserted when you compile the file.
- You can replace “2023-12-04” by “2022-12-14” or in any date format surrounded by double quotation marks.
- Section numbers: - default is
number_sections: no. - Table of contents,
toc: true- default istoc: false. - Floating table of contents in HTML output,
toc_float: true- default istoc_float: false
3.6.2 Create a Code Chunk to Attach Packages
Insert Chunk in Code pull down menu in the top bar, or use the C button on top. You can use shortcut keys listed under Tools in the top bar.
We have installed the package tidyverse. However, in order to use it, we need to attach, or load, by calling library(tidyverse).
You can run the code in a code chunk by clicking the triangle mark at the top right corner.
library(tidyverse)
#> ── Attaching core tidyverse packages ──── tidyverse 2.0.0 ──
#> ✔ dplyr     1.1.3     ✔ readr     2.1.4
#> ✔ forcats   1.0.0     ✔ stringr   1.5.0
#> ✔ ggplot2   3.4.4     ✔ tibble    3.2.1
#> ✔ lubridate 1.9.3     ✔ tidyr     1.3.0
#> ✔ purrr     1.0.2
#> ── Conflicts ────────────────────── tidyverse_conflicts() ──
#> ✖ dplyr::filter() masks stats::filter()
#> ✖ dplyr::lag()    masks stats::lag()
#> ℹ Use the conflicted package (<http://conflicted.r-lib.org/>) to force all conflicts to become errors
3.7 First Example
3.7.1 Importing data
Let us assign the iris data in the pre-installed package datasets to df_iris. You can give any name starting from an alphabet, though there are some rules.
The class of data iris is data.frame, the basic data class of R. You can assign the same data as a tibble, the data class of tidyverse as follows.
-
df_iris <- iriscan replacedf_iris <- datasets::irisbecause the packagedatasetsis installed and attached as default. Since you may have other data calledirisincluded in a different package or you may have changedirisbefore, it is safer to specify the package’s name with the data’s name. - Within R Notebook or in Console, you may get different output, and
tf_irisandtbl_irisbehave differently. It is because of the default settings of R Markdown.
3.7.2 Look at the data
3.7.2.1 Several ways to view the data.
The View command opens up a window to show the contents of the data, and you can also use the filter.
View(df_iris)The following simple command also shows the data.
df_iris#> Sepal.Length Sepal.Width Petal.Length Petal.Width
#> 1 5.1 3.5 1.4 0.2
#> 2 4.9 3.0 1.4 0.2
#> 3 4.7 3.2 1.3 0.2
#> 4 4.6 3.1 1.5 0.2
#> 5 5.0 3.6 1.4 0.2
#> 6 5.4 3.9 1.7 0.4
#> 7 4.6 3.4 1.4 0.3
#> 8 5.0 3.4 1.5 0.2
#> 9 4.4 2.9 1.4 0.2
#> 10 4.9 3.1 1.5 0.1
#> Species
#> 1 setosa
#> 2 setosa
#> 3 setosa
#> 4 setosa
#> 5 setosa
#> 6 setosa
#> 7 setosa
#> 8 setosa
#> 9 setosa
#> 10 setosa%>% is called a pipe command, and we use it often.
The output within R Notebook is a tibble style. Try the same command in Console.
slice(df_iris, 1:10)
#>    Sepal.Length Sepal.Width Petal.Length Petal.Width
#> 1           5.1         3.5          1.4         0.2
#> 2           4.9         3.0          1.4         0.2
#> 3           4.7         3.2          1.3         0.2
#> 4           4.6         3.1          1.5         0.2
#> 5           5.0         3.6          1.4         0.2
#> 6           5.4         3.9          1.7         0.4
#> 7           4.6         3.4          1.4         0.3
#> 8           5.0         3.4          1.5         0.2
#> 9           4.4         2.9          1.4         0.2
#> 10          4.9         3.1          1.5         0.1
#>    Species
#> 1   setosa
#> 2   setosa
#> 3   setosa
#> 4   setosa
#> 5   setosa
#> 6   setosa
#> 7   setosa
#> 8   setosa
#> 9   setosa
#> 10  setosa
1:10
#>  [1]  1  2  3  4  5  6  7  8  9 10
3.7.2.2 Data Structure
Let us look at the structure of the data. You can try str(df_iris) on Console or by adding a code chunk in R Notebook introducing later.
glimpse(df_iris)
#> Rows: 150
#> Columns: 5
#> $ Sepal.Length <dbl> 5.1, 4.9, 4.7, 4.6, 5.0, 5.4, 4.6, 5.…
#> $ Sepal.Width  <dbl> 3.5, 3.0, 3.2, 3.1, 3.6, 3.9, 3.4, 3.…
#> $ Petal.Length <dbl> 1.4, 1.4, 1.3, 1.5, 1.4, 1.7, 1.4, 1.…
#> $ Petal.Width  <dbl> 0.2, 0.2, 0.2, 0.2, 0.2, 0.4, 0.3, 0.…
#> $ Species      <fct> setosa, setosa, setosa, setosa, setos…
There are six types of data in R; Double, Integer, Character, Logical, Raw, and Complex. In this course, we use only the first four.
The names after $ are column names. If you call df_iris$Species, you have the Species column. Species is in the 5th column, typeof(df_iris[[5]]) does the same as the next.
df_iris[2,4] =0.2 is the fourth entry of Sepal.Width.
typeof(df_iris$Species)
#> [1] "integer"
class(df_iris$Species)
#> [1] "factor"
For factors = fct see the R Document or an explanation in Factor in R: Categorical Variable & Continuous Variables.
Q1. What are the differences of df_iris, slice(df_iris, 1:10) and glimpse(df_iris) above?
Q2. What are the differences ofdf_iris, slice(df_iris, 1:10) and glimpse(df_iris) in the console?
3.7.2.3 Summary of the Data
The following is very convenient to get the summary information of a data.
summary(df_iris)
#>   Sepal.Length    Sepal.Width     Petal.Length
#>  Min.   :4.300   Min.   :2.000   Min.   :1.000
#>  1st Qu.:5.100   1st Qu.:2.800   1st Qu.:1.600
#>  Median :5.800   Median :3.000   Median :4.350
#>  Mean   :5.843   Mean   :3.057   Mean   :3.758
#>  3rd Qu.:6.400   3rd Qu.:3.300   3rd Qu.:5.100
#>  Max.   :7.900   Max.   :4.400   Max.   :6.900
#>   Petal.Width          Species
#>  Min.   :0.100   setosa    :50
#>  1st Qu.:0.300   versicolor:50
#>  Median :1.300   virginica :50
#>  Mean   :1.199
#>  3rd Qu.:1.800
#>  Max.   :2.500
Minimum, 1st Quadrant (25%), Median, Mean, 3rd Quadrant (75%), Maximum, and the count of each factor.
3.7.3 Visualizing Data
3.7.3.1 Scatter Plot
We use ggplot to draw graphs. The scatter plot is a projection of data with two variables \(x\) and \(y\).
ggplot(data = <data>, aes(x = <column name for x>, y = <column name for y>)) +
  geom_point()
ggplot(data = df_iris, aes(x = Sepal.Length, y = Sepal.Width)) +
geom_point()
ggplot(data = df_iris, aes(x = Sepal.Length, y = Sepal.Width)) +
  geom_point()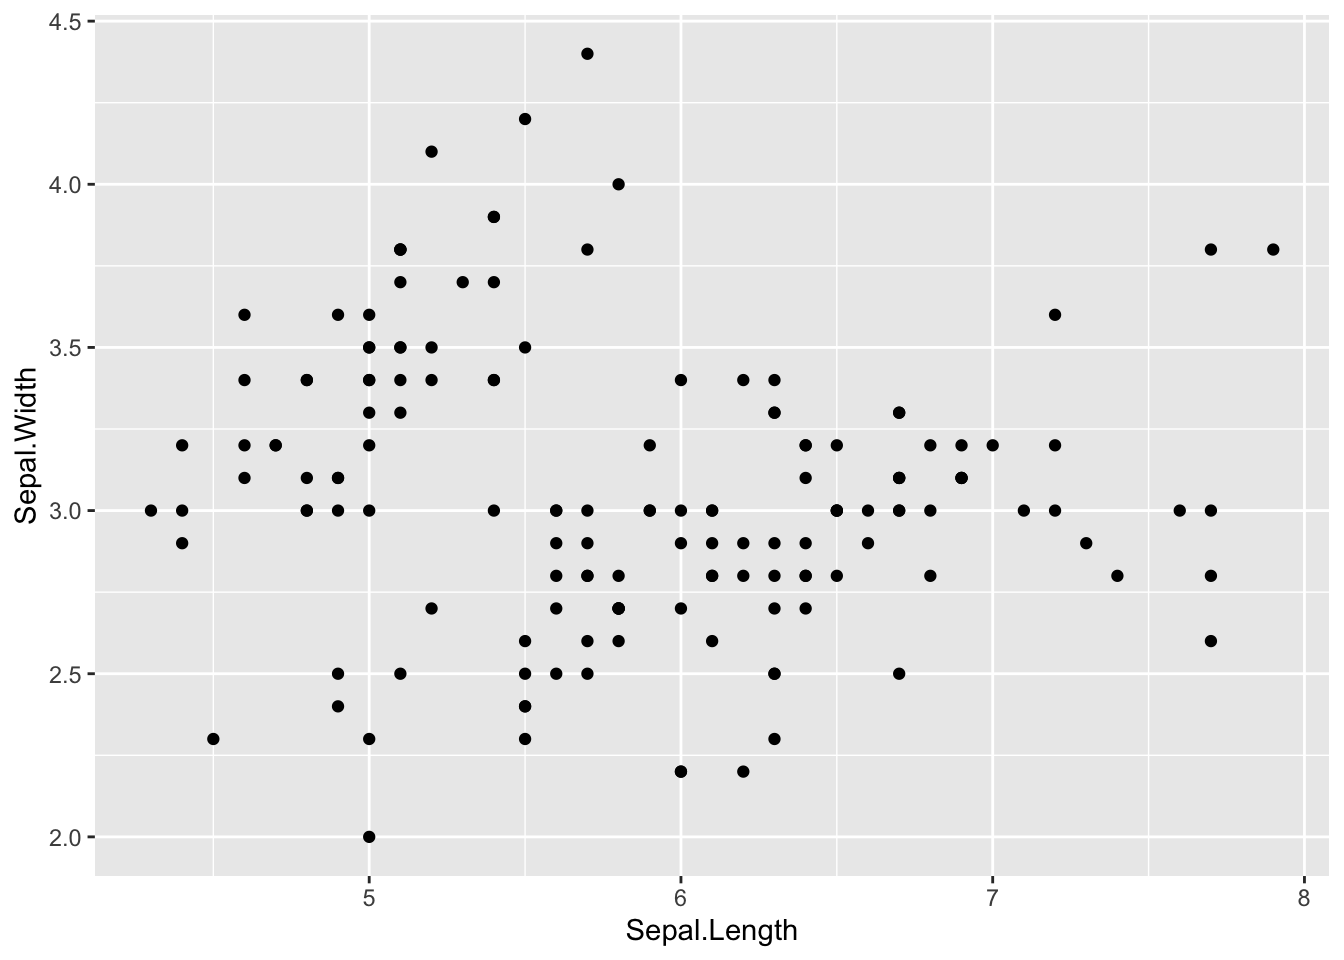
3.7.3.2 Scatter Plot with Labels
Add title and labels adding labs().
ggplot(data = <data>, aes(x = <column name for x>, y = <column name for y>)) +
geom_point() +
labs(title = "Title", x = "Label for x", y = "Label for y")
ggplot(data = df_iris, aes(x = Sepal.Length, y = Sepal.Width)) +
geom_point() +
labs(title = "Scatter Plot of Sepal Data of Iris", x = "Sepal Length", y = "Sepal Width")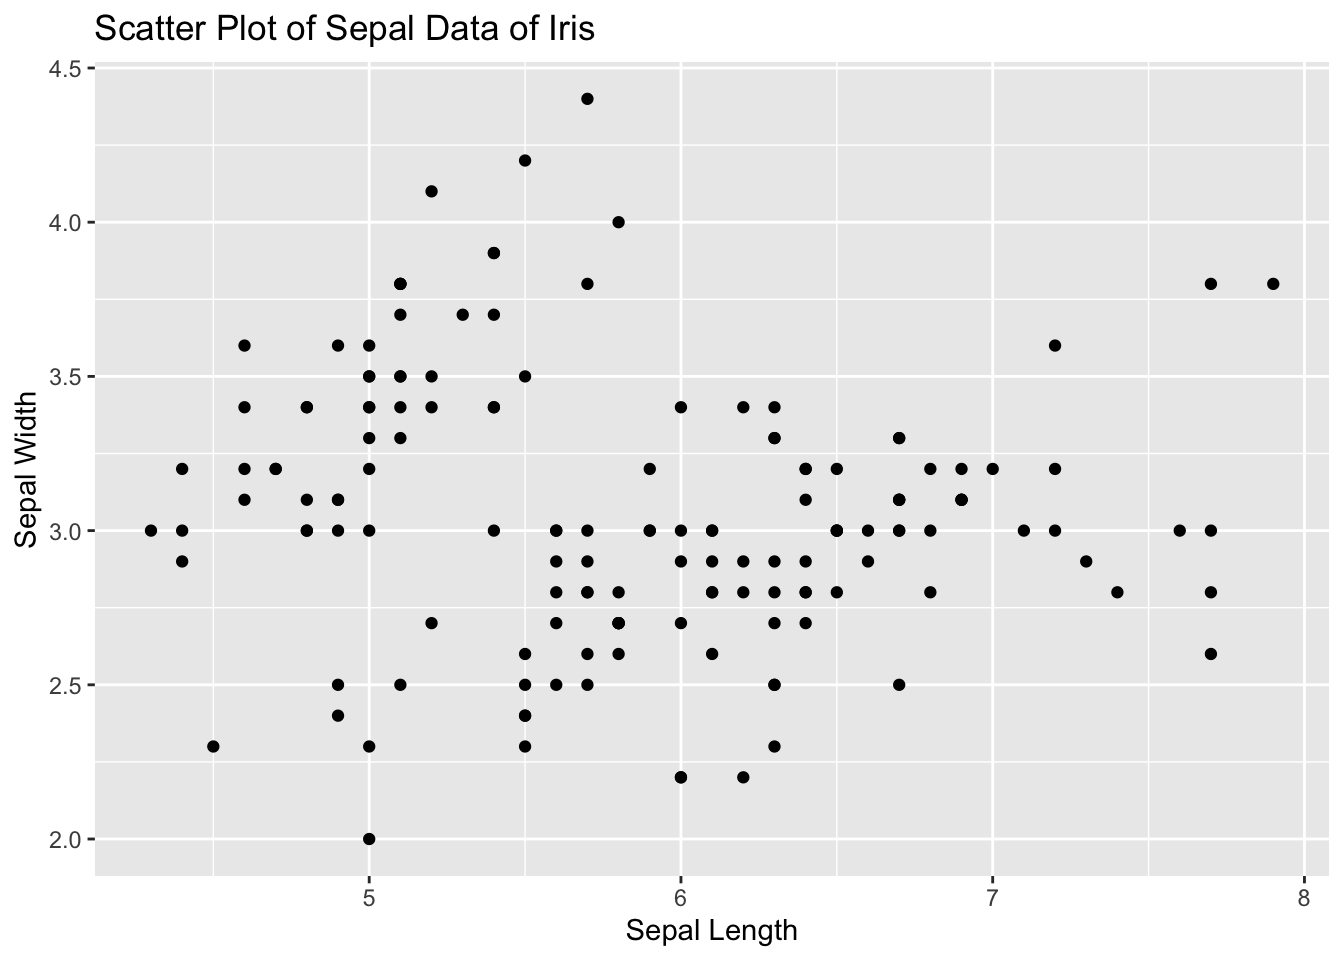
3.7.3.3 Scatter Plot with Colors
Add different colors automatically to each species. Can you see each group?
ggplot(data = df_iris, aes(x = Sepal.Length, y = Sepal.Width, color = Species)) +
  geom_point()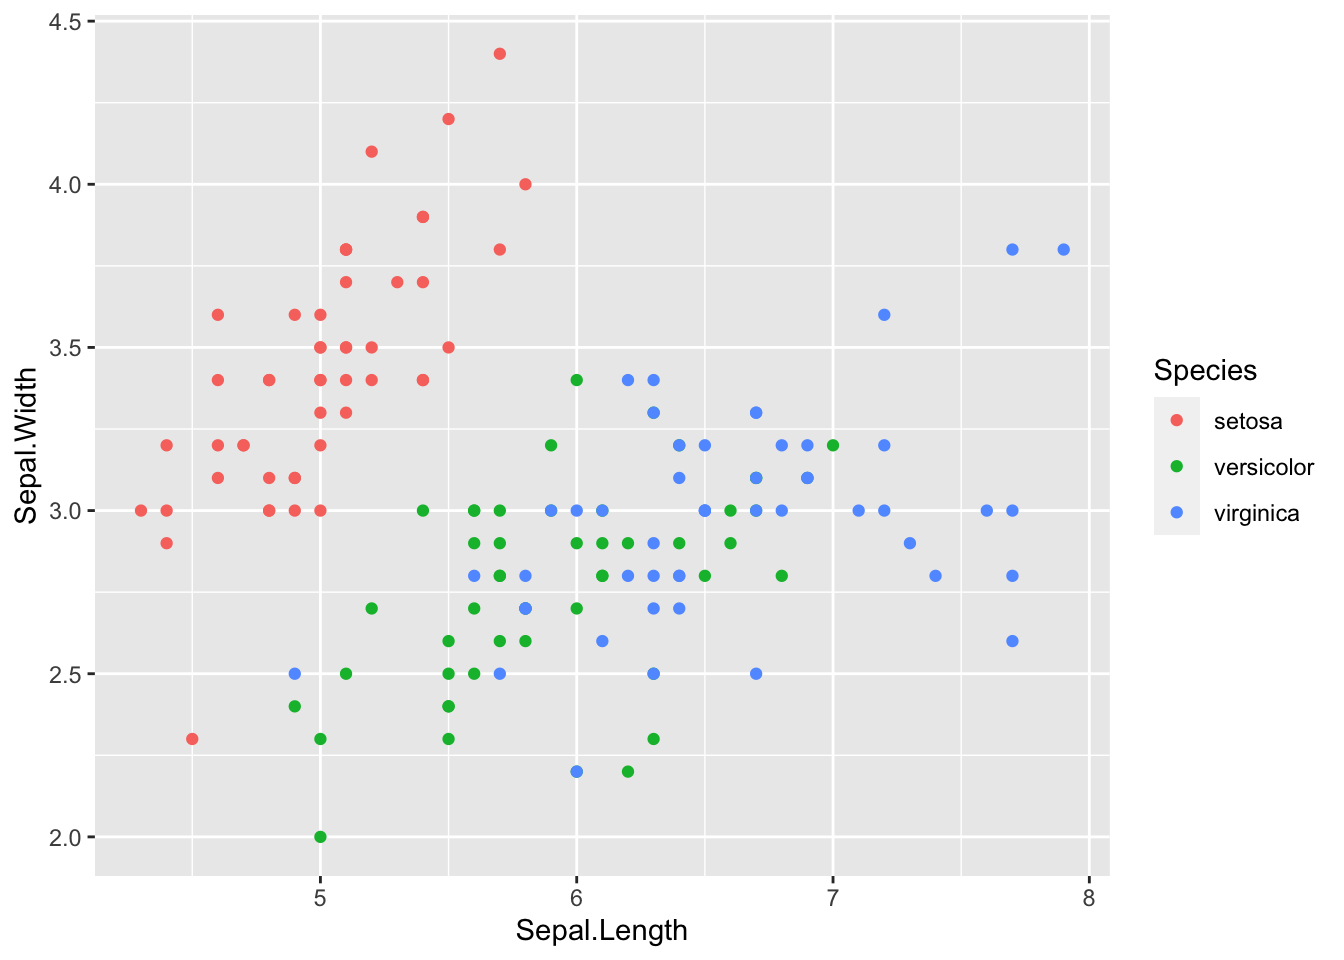
3.7.3.4 Scatter Plot with Shapes
ggplot(data = df_iris, aes(x = Sepal.Length, y = Sepal.Width, shape = Species)) +
  geom_point()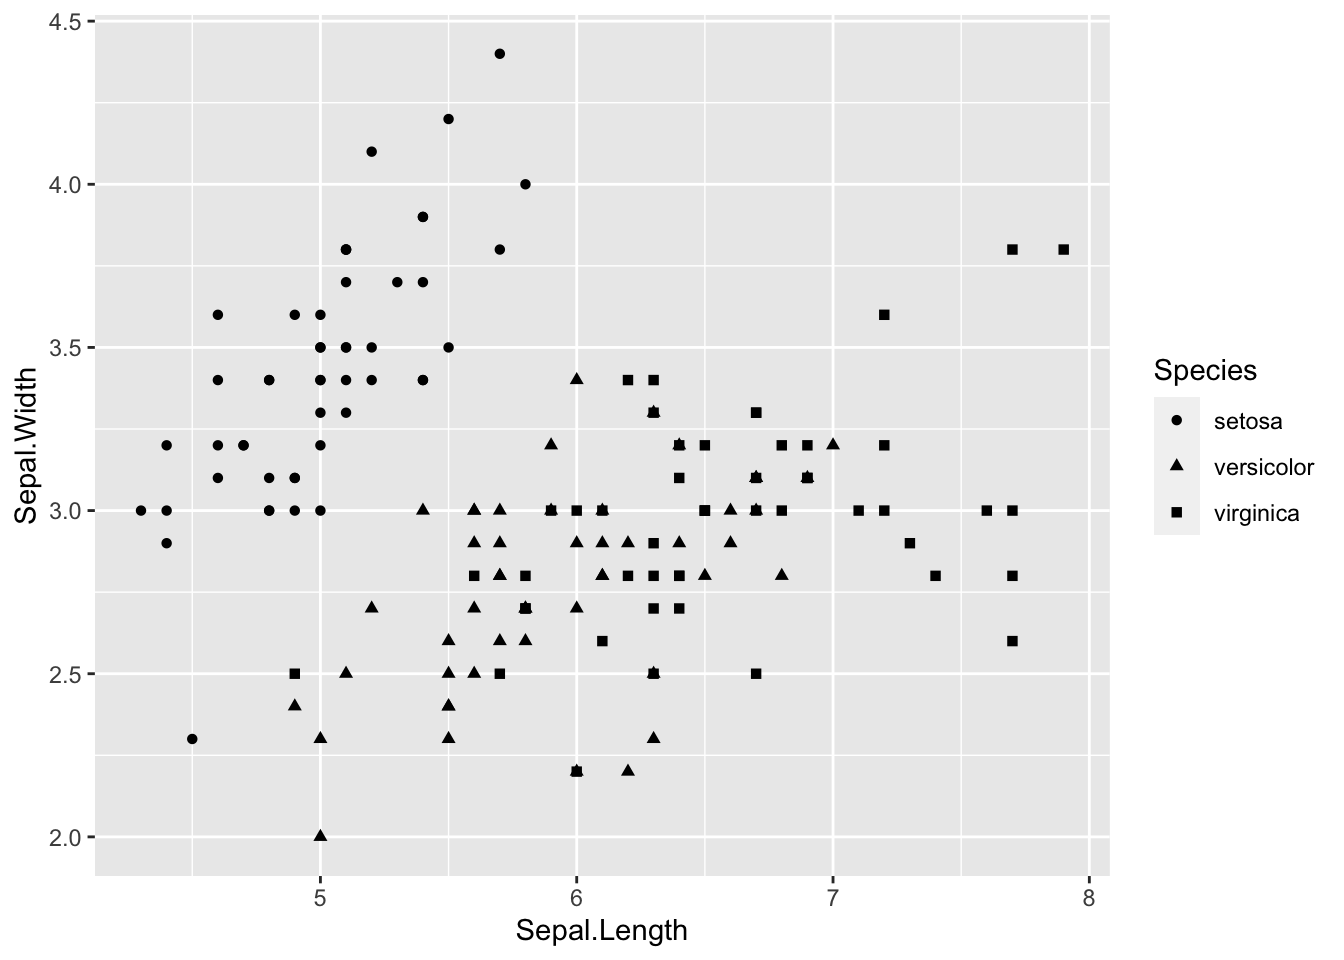
3.7.3.5 Boxplot
The boxplot compactly displays the distribution of a continuous variable.
ggplot(data = df_iris, aes(x = Species, y = Sepal.Length)) +
  geom_boxplot()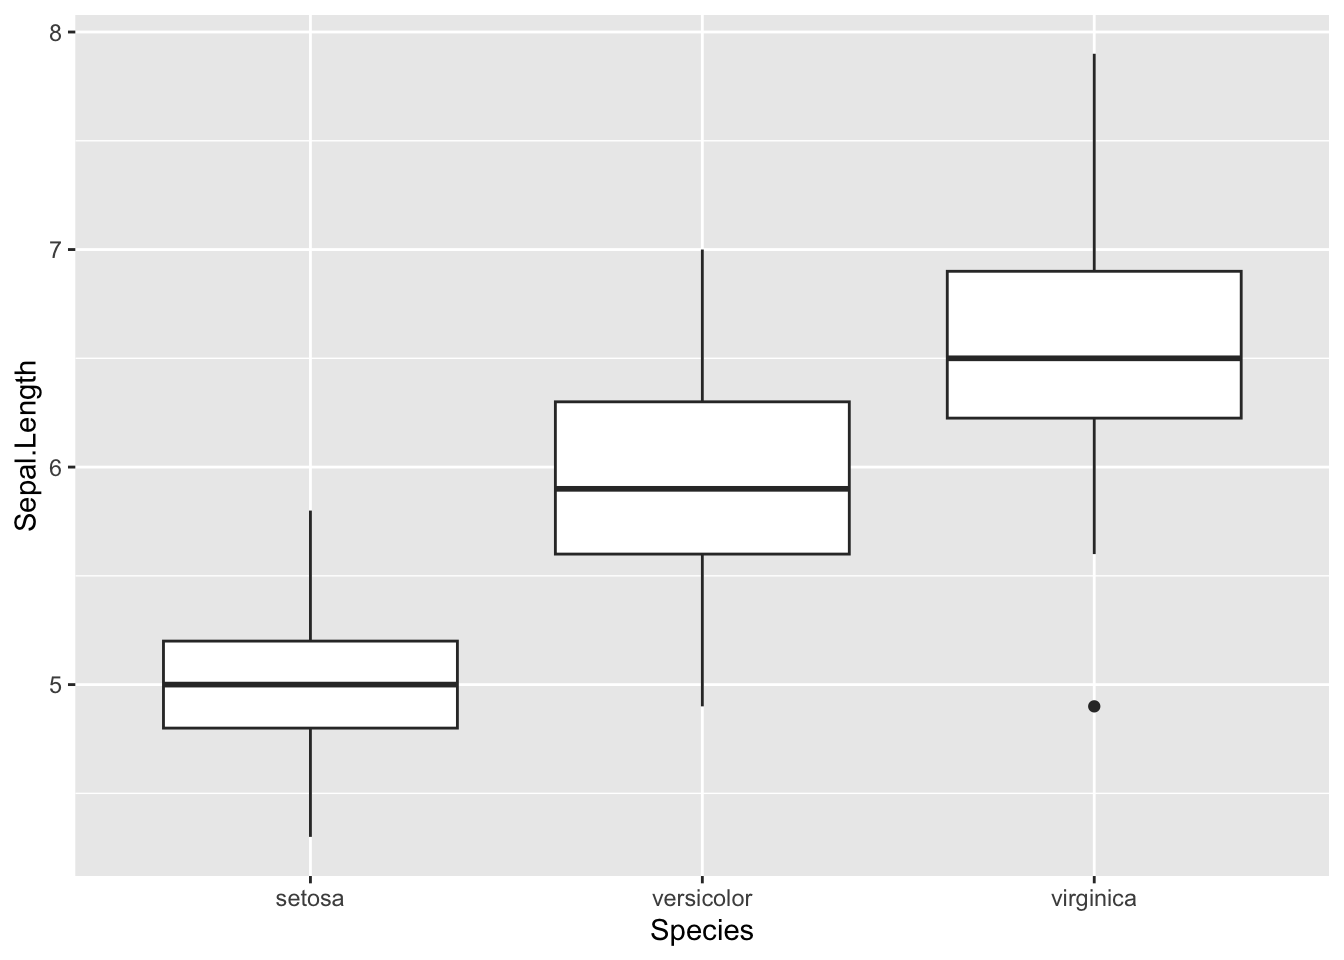
3.7.3.6 Histogram
Visualize the distribution of a single continuous variable by dividing the x axis into bins and counting the number of observations in each bin. Histograms (geom_histogram()) display the counts with bars.
ggplot(data = df_iris, aes(x = Sepal.Length)) +
  geom_histogram()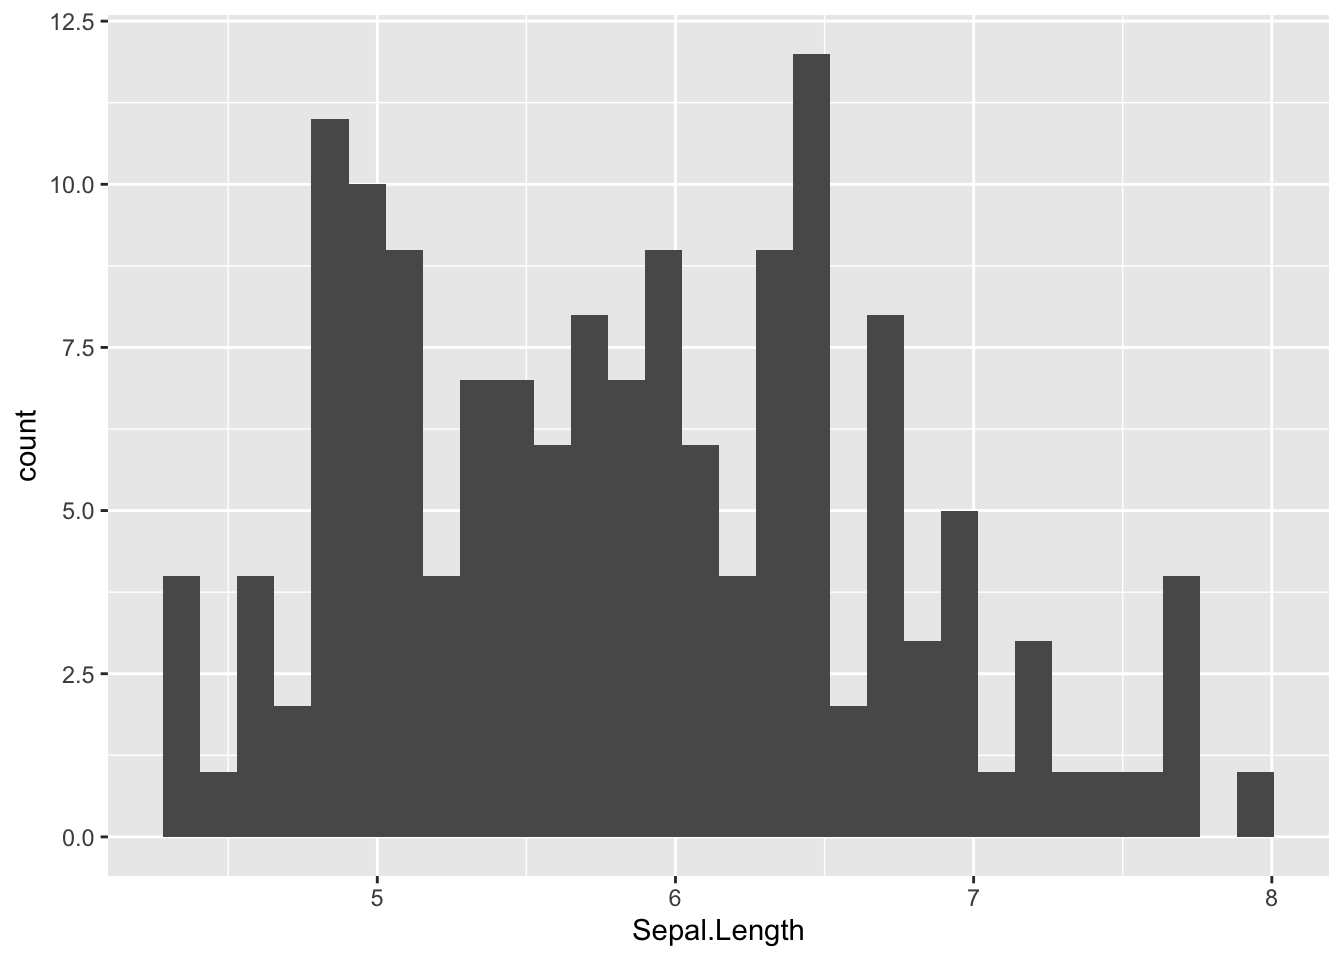
Change the number of bins by bins = <number>.
ggplot(data = df_iris, aes(x = Sepal.Length)) +
  geom_histogram(bins = 10)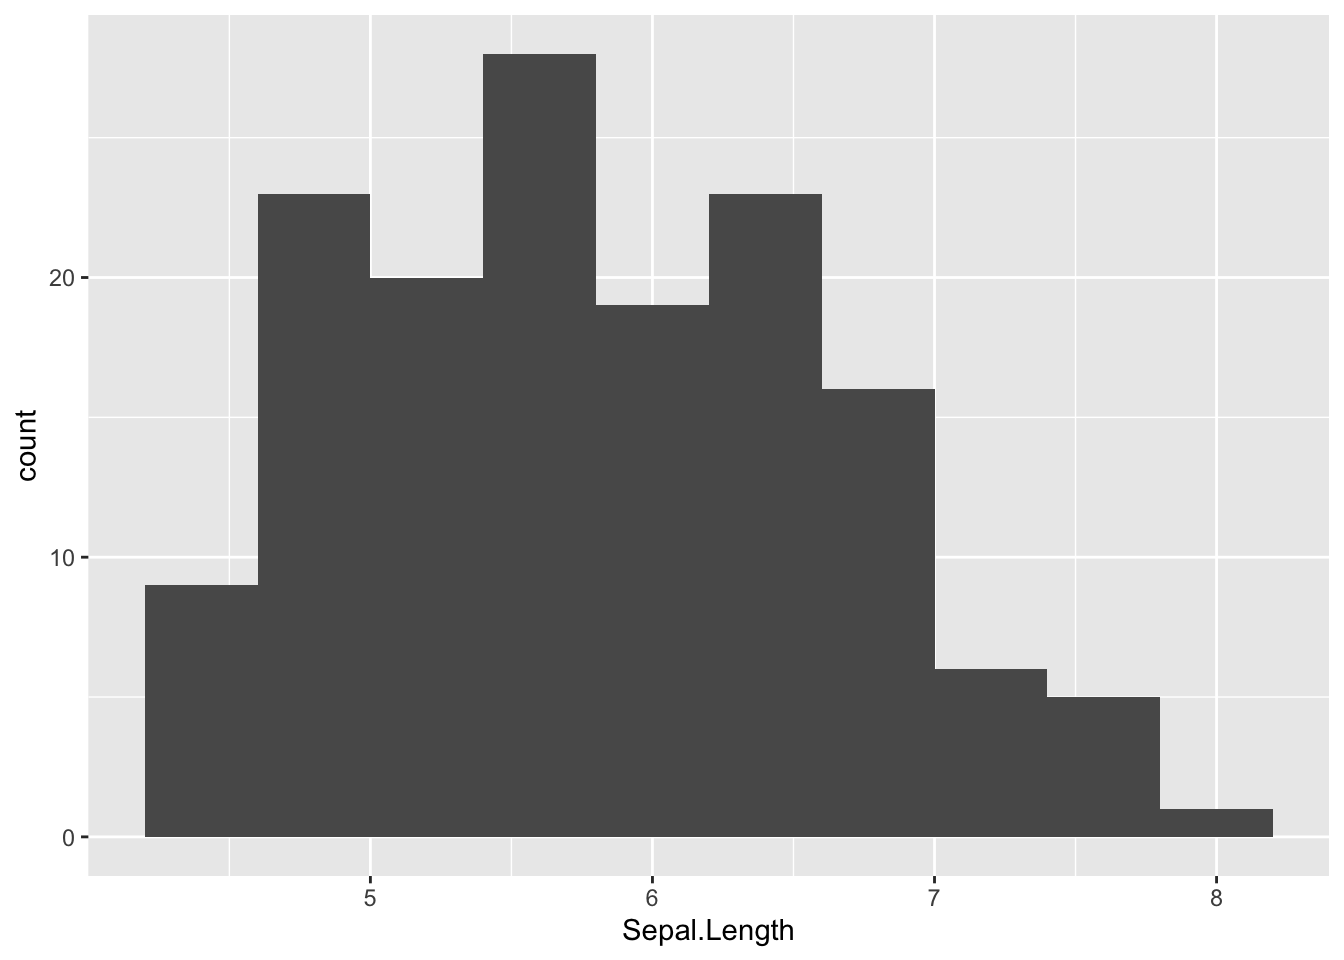
3.7.4 Data Modeling
Professor Kaizoji will cover the mathematical models and hypothesis testings.
ggplot(data = df_iris, aes(x = Sepal.Length, y = Sepal.Width)) +
  geom_point() +
  geom_smooth(method = "lm", se = FALSE)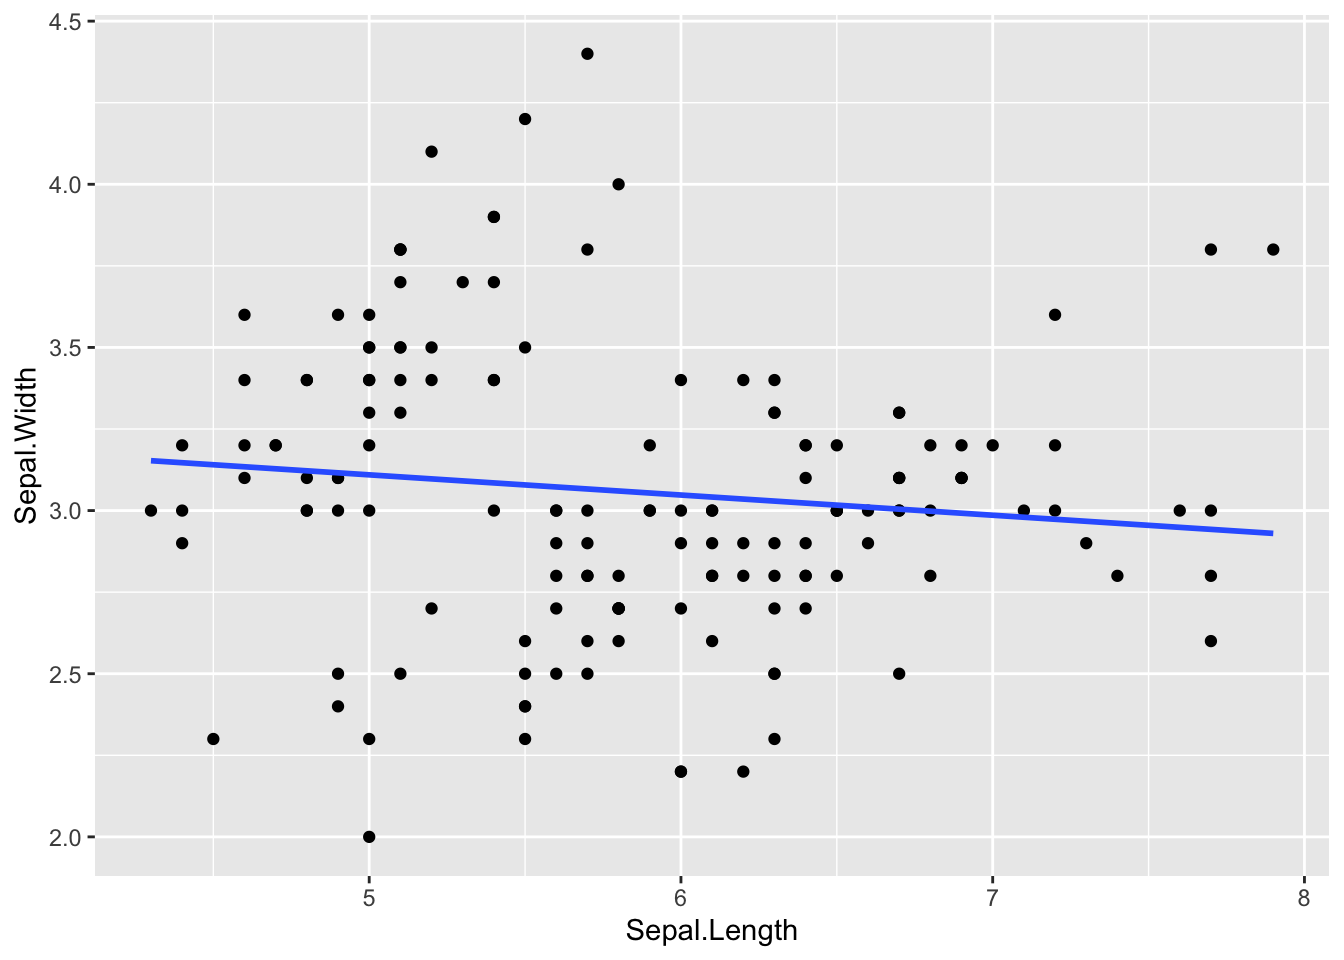
Review
- R on R Studio/Posit Cloud (RStudio Cloud)
- Three ways to run codes
- Console
- R Script
- Code Chunk in R Notebook
- Packages
tidyversermarkdowngapminder
3.9 First Assignment
- Assignment Week 2-1: Introduction Plus Forum
Please write the following.
- A brief self-introduction. … please call me ……
- What do you expect from this course?
- A list of five to ten questions on Covid-19 or other topics you want to study by data.
My response (an example):
- Hiroshi Suzuki, an instructor of this course, retired from ICU in 2019. Please call me Suzuki-san or Suzuki-sensei.
- I hope to develop a learning community on data science.
- Questions (on Covid-19).
- How can we prepare for the next pandemic?
- What are the key ethical issues of vaccine mandate and vaccine passport?
- How can we assess the efficacy of various vaccines?
- What are the determining factors of the mortality rate of each country?
- What can we do in this pandemic for the most vulnerable people?
- Due: Tuesday, 20 December 2022, 11:59 PM
3.9.1 Responses - Except the self-introduction
A.
As I have no prior knowledge of using applications such as R studio for data analysis, I would like to understand and obtain the knowledge of the techniques and put it into use in my studies and career in the future.
-
Questions about covid
- What are the impacts of COVID-19 on mental health?
- What group of people is the most affected by COVID-19 on their menntal health issue? (age, gender, work class, etc)
- What can we do to alleviate the impact of COVID-19 on mental health?
- What are the impacts of COVID-19 on envrionment?
- How do the governments in different countries deal with solid waste expose during the pandemic?
B.
From this course I expect to learn how to use R, strengthen my skills in doing quantitative research in coalition with qualitative approaches (mixed-methods) and visualizing data, and process some data related to my thesis research topic.
-
Questions
- Can a gender approach give new understandings of the armed conflict in Colombia?
- How can we assess the relationship between gender and the occurrence of violence within the Colombian armed conflict?
- How are masculine values and patriarchy related to violence within the Colombian armed conflict?
- How can be the relationship between gender and violence be quantified?
- What kind of initiatives could be effective to promote cultural and gender values for peace in Colombia?
C.
I have no prior knowledge or skill when it comes to data analysis and collection so I hope to gain some knowledge and understand how to analyse data in my academic career.
-
COVID-19 questions:
- How can countries be better prepared for future pandemic outbreaks?
- What various methods were adopted by different communities when dealing with the mental health effects of lockdown?
- How has the pandemic impacted the socialisation of toddlers and young children?
- Will the use of face masks become the new normal or will people eventually defer back to a mask-less existence?
- What are the chances of recovering from long covid in young people?
D.
I hope to develop my skills in data science and data analysis through this course.
-
Questions on Global Health issues:
Is the COVID-19 pandemic over?
Were underrepresented communities less or more affected by the COVID-19 pandemic?
How can access to healthcare barriers in remote areas be reduced?
Is there a correlation between income levels and the prevalence of non-communicable diseases?
Can basic health education help decrease the prevalence of non-communicable diseases in communities?
E.
- My expectation from this course
I hope to learn the fundamentals of data science by using the free software, R and its IDE, R Studio. This course will be helped me to learn, how to collect data, transform data into appropriate forms, visualize data, how to analyze data and present the findings to others.
- Questions (on Covid-19)
How does Covid-19 compare to other public health threats?
How effective are masks and do they also need to cover my nose?
Is Covid-19 worse than flu?
Why do governments benefit from helping to ensure other countries access vaccines?
What are the determining factors of the mortality rate of each country?
What are the risks of re-infection?
Should I be concerned that the sample sizes in vaccine clinical trails were not bigger?
Do I still need to worry about infection even though I am fit and healthy?
How can we prepare for the next pandemic?
How can we trust vaccines that have been developed so fast?
F.
In this course I would like to review basic statistical skills with the application of R programming.
-
Questions on Covid-19:
- What are the key characteristics of Covid-19 related data?
- What are the major data issues of Covid-19?
- How can data accuracy during a pandemic such as Covid-19 be improved?
- What is to be considered when comparing Covid-19 data across countries?
- How can data support measures of disaster risk reduction to reduce further outbreaks?
G.
I hope to learn how to effectively use R for data analysis and visualization for my thesis and future work.
-
I would like to look at poverty data:
What is the best way to measure poverty?
Is poverty to be regarded as absolute or relative?
is it possible to compare poverty data across societies?
What policies are most effective to alleviate poverty?
How do we evaluate policies and programs with regard to multi-dimensional poverty?
H.
From this course, I wish to gain skill which will enable me analyze data using Rstudio applications related to my field of research and other aspect of life and the world in general.
-
questions (Food Inflection)
What are the targeted areas of the world is the world bank more concern in term of food crises?
what are the interest rate attributed to the support given to these countries by the world bank?
it is possible for countries with the most fertile and unused land ranked as countries with high food inflection rate? why?
On what facts are the data between the world bank, developed nations and developing nations analyzed?
How will the raise of modified genetic food affect the world in generations to come?
I.
Data analysis is an essential aspect of the research process. R is a free, convenient, and popular program among scholars. I hope to learn the R program and use R in data analysis for my final thesis.
-
Questions
What adverse effects are associated with vaccination?
How does the risk-benefit ratio for COVID-19 vaccination differ in children?
How does the COVID-19 pandemic affect economic growth?
How efficacious is vaccination at preventing symptomatic COVID-19?
How effective is vaccination against Omicron and its subvariants?
What are the indications and contraindications of vaccination?
What factors affect the high mortality in elderly people?
J.
I hope I can learn more about analyzing data via R. It will help me a lot in my assignments and research.
-
Questions (about climate change):
What is the greenhouse effect?
How can we assess the effect of climate change to economic?
What are the most vunerable countries effected by climate change? Developed countries or Developing countries
Which countries have the largest CO2 emissions?
What can we do to stop global warming?
K.
From this course I hope to gain skills that I can use in my current research, or future research/career.
-
Questions (on Covid-19).
What is the prevalence of long COVID?
What groups of people does long COVID most impact?
Are there certain music genres that may help people with alzheimer’s?
will we actually run out of fossil fuel, if ever?
What present day animal species are on the brink of extinction?
L.
My expectation on the course is to learn the way of mulivarible analyses including PCA (principal component analysis) and other mochine learning methods with R.
-
Questions (Japanese views on Religion, Nature, and Science)
What percentage of Japanese are religious?
What kind of religions are Japanese believe in?
What do Japanese expect on religions?
What percentage of Japanese believe existence of Heaven?
What percentage of Japanese believe Creation of Earth and human by God?
What percentage of Japanese disbelieve Evolution theory?
What percentage of Japanese believe existence of extra-terrestrials?
8.Correlations among above items.
M.
I hope to review R basics and learn about using R for data cleaning and visualisation. I had the opportunity before to use R to run various linear regressions, so I. hope to learn R programming knowledge that would complete that.
-
Questions on COVID-19:
What was the effect of COVID-19 on worldwide inequalities, particularly concerning health care access?
Did the Japanese government actions, such as distributing 100,000 Yen to households during the COVID, stimulated consumption or savings?
What percentage of government spendings were allocated to the COVID-19 when the pandemic started compared to now?
How did the COVID-19 affected economic development of underdeveloped countries?
How was the job market affected by the COVID-19?
N.
-
Questions.
Impact of workers remmitance of savings rate in Pakistan.
How the exchange rate affects the worker’s remittances in Pakistan.
What is the impact of the interest rate on the savings rate?
How fiscal policy affects the savings rate.
- What is the relationship between savings and consumption?
O.
I am interested in learning analysis by using R software and intend to use R in data analysis for my thesis.
-
Questions:
What is impact of FDI on Economic growth of a country?
What is impact of FDI on stock exchange performance of a country?
How inward FDI contributes to GDP growth of a country?
How can we analyze timeseries data?
How do we analyze the impact of an incident on time series data? How to perform Pre and post incident analysis?
P.
Learning R-Studio will help me in my research methodology. I am hopeful to learn how to assess the different databases using R-studio and make graphs.
-
Questions (Climate Change).
How can we save the world from the effects of climate change?
What are the key ethical issues of Climate change on temperature and precipitation?
How can we assess climate change’s impact on countries’ economic growth?
What factors determine the climate change impact on the economic growth of each country?
How can we reduce the effect of climate change on countries?
Q.
I hope I can learn more on how I can analyze data via R. There are a lot of different models in R, if I can learn more about these models will be perfect.
-
Questions:
P value and T check and etc, I only have a very sensitive feeling about them. Can we learn more about this?
How can I do time seris analysis in R?
If I have my own hypothesis about a specific topic, how can I check the data via R?
4.Will we learn more about economic analysis?
5.From the data analysis, we know a lot of corelation check, what’s more we can explore ?
R.
I want to explore and compare the different data related to global higher Education from this course.
-
Questions:
After Japan released international traveling, how is Covid-19 impacted Japan’s health system?
What necessary methods have been done in Japan during the post-pandemic period?
Compared to the previous vaccination policy, how does data show the percentage of people who got the fourth vaccination?
What are the differences between Japan and other developed countries to Covid-19 prevention measures in universities?
How do students and faculties react to these pandemic precautionary approaches? Whether international and local students have similar perspectives?
S.
I hope to experience using R, hopefully become more comfortable with playing with numerical data. My quantitative research method skill right now is very limited.
-
Questions (Covid-19):
How pandemic affected the movement of foreign technical trainees?
How can we assist social rights of foreigner’s living in Japan during the pandemic?
What are the key factors that affected college student’s mental health during pandemic?
What were the key reinforcement during the pandemic for high criminal rates of foreign technical trainees?
How pandemic affected the domestic violence in Japan?
How public education were impacted from pandemic on students’ study habit?
3.8 Comments
3.8.1 Helpful Resources
Cheat Sheet in RStudio: https://www.rstudio.com/resources/cheatsheets/
‘Quick R’ by DataCamp: https://www.statmethods.net/management
An Introduction to R
3.8.2 Practicum
3.8.3 Posit Primers https://posit.cloud/learn/primers
3.8.4 Questions